![]() Graphical output
Graphical output
![]() Graphical output
Graphical output
|
<< Click to Display Table of Contents >>
|
  
|
Quick start basics - Your first simulation session .
| 1. | If the transient table is not visible, select Results|Transient|Table of the project window. If the transient data is cleared, perform the actions as specified in Running transient simulations. |
| 2. | Click Graph in the table window. |
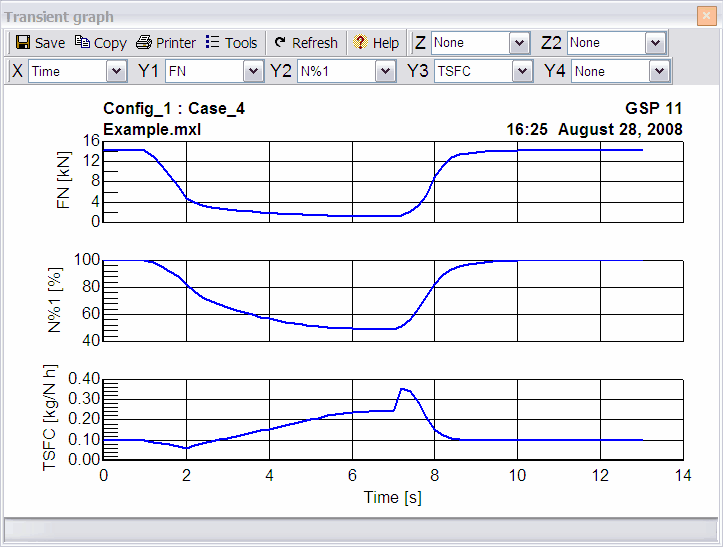
The transient table graph appears.
| 3. | Select FN for the first y-axis Y1 by clicking |
| 4. | Repeat step 3 for N%1 as 2nd y-axis and TSFC as 3rd y-axis. |
If the transient graph panel is docked and too small to view the graphical results, undock (imply drag the panel by the tab) the panel and resize it to a larger size. The transient table graph shown below (shown undocked) displays the graphical output of the transient simulation.

| 5. | Optionally select Tools|Options from the graph window menu to set general graph parameters including scaling, labeling or line styles. |
| 6. | Optionally select File|Save graph as BMP file or File|Save graph as Meta file from the graph window menu to save the graph to disk. Alternately select File|Copy Bitmap to clipboard or File|Copy Meta file to clipboard from the graph window menu to copy the graph to the clipboard for immediate use in other applications. For enhanced use in for instance word processors, you are recommended to save graphs as meta file. |
| 7. | Repeat the process for similar graphs with other output parameters. |
Especially with transient data it is interesting to select other parameters besides time as x-axis.