![]() Graph templates
Graph templates
![]() Graph templates
Graph templates
|
<< Click to Display Table of Contents >>
|
  
|
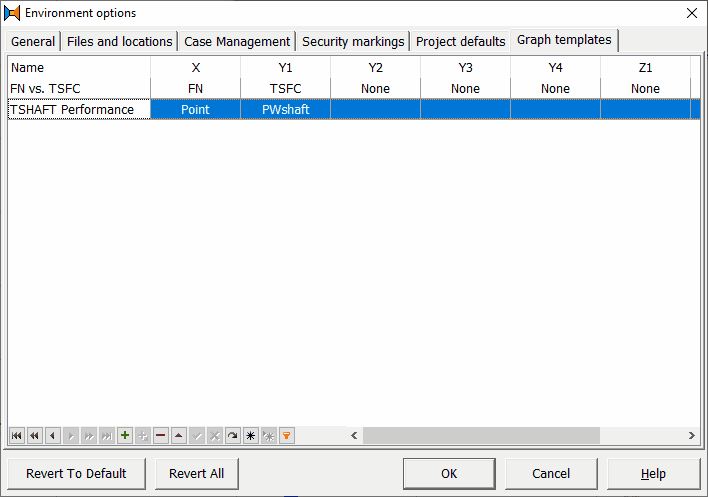
To facilitate quick graphical representation of your tabulated data, templates can be created. The graph template functionality consists of 2 elements:
•Selecting a stored template or adding a new template (the current graphical view)
Use the toolbar:
![]()
to save a graphical view of tabulated data (press the button with the '+' sign, or alternatively press Tools|Store graph as template) of the Steady-State graph or Transient graph tab sheet.
•Storage in the Environment options: