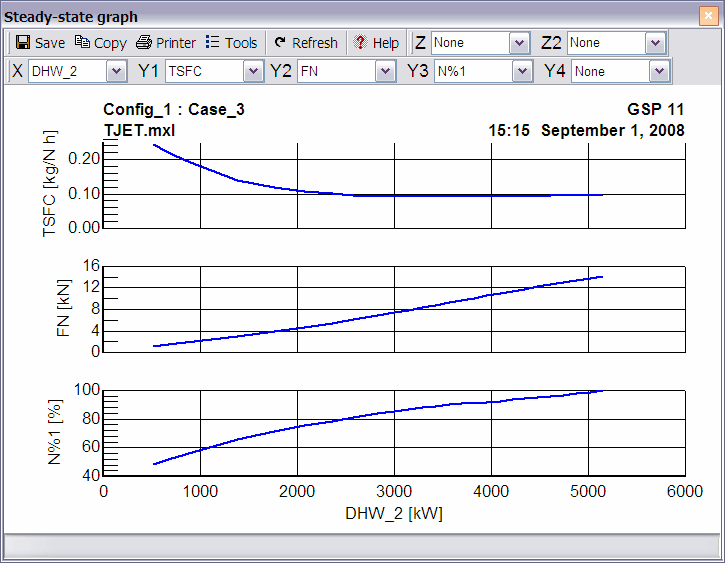
Graphical representations of the table output as shown in the figure are obtained by clicking the Show graph button in the table output window.
Parameters for the X-axis and up to 4 Y-axes can be specified from those selected for the output table.
Axis and graph options can be changed by selecting Tools|Options|Axis/Layout. Multiple simulation results can be placed in one graph if you have inserted breaks between simulation runs. You can show all (up to 4) parameters in a single graph with a common X-axis parameter by selecting Tools|Options|All curves in single graph. Graphical layout can be saved to create a graph template for later use or quick switching.
Graphs can be saved or copied to the clipboard or to files in bitmap or meta file format using the file menu. For best results, it is recommended to use the meta file format for export to other application such as word processors.
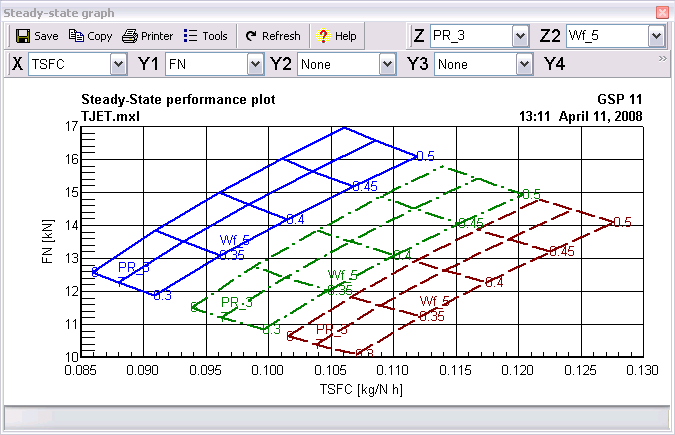
When options Tools|Carpet is enabled the current data will be transformed into a carpet (surface) plot. Parameter labels and values can be displayed using Tools|Options|Legend|Parameter "Z" and Tools|Options|Legend|Parameter "Z2", as well as their position on the srceen. Multiple carpets in a single graph can be realized by adding 'group breaks' added in output table to separate different carpets of groups of curves. With every new group, graph settings, line colors etc. start from first again.
Both steady state and transient simulation results can be plotted in most component maps, as displayed in the next figure, to assess component performance during simulation (e.g. to assess compressor stall margin during acceleration). Before you can view the simulation results, the map needs to be scaled to the model design point using Tools|Options|Scale to Model des. pnt. in the map graph window. To show the operating curves, check the Draw St.St. Points or Draw Transient items in the Options menu. The curve line styles can be adapted using the Line Styles button, accessible through Axes/Layout in the Options menu. Note that these line styles are set the same as the steady state respectively transient table graph output line styles.


