![]() Multiple output curves
Multiple output curves
![]() Multiple output curves
Multiple output curves
|
<< Click to Display Table of Contents >>
|
  
|
Quick start basics - Your first simulation session .
| 1. | If the transient table is not visible, select Results|Transient|Table in the model window. If the transient data is cleared, perform the actions as specified in Running transient simulations. |
| 2. | Click the 'append break button' of the table window toolbar to append a break line. |
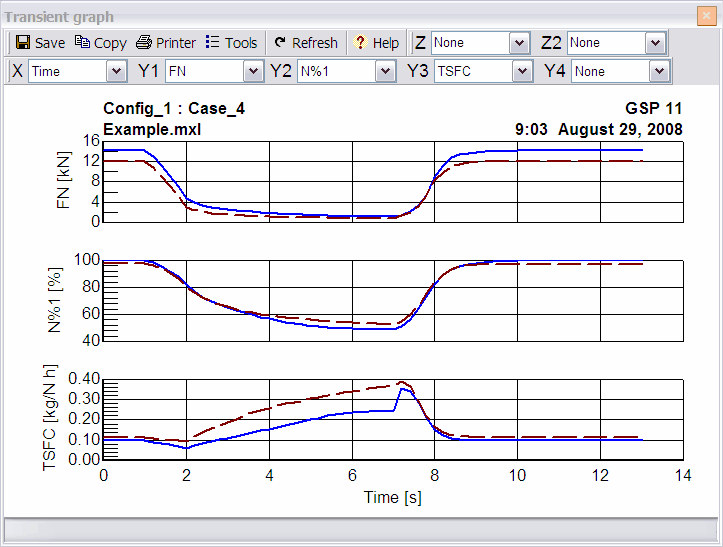
The graph window will automatically interpret the break lines as curve separators.
| 3. | Click Amb.Cond. above the project tree. |
| 4. | Click the Off-design conditions tab sheet. |
| 5. | Change the Air Speed Mach value to 0.4 and click OK. |
| 6. | Run the model to perform the transient calculation (set time to 0, click OK in the set start time window and Yes in the stabilize window). |
| 7. | Click Graph in the transient table window. |
The graph is displayed, with 2 curves for Mach 0.0 (blue) and 0.4 (black dashed).

| 8. | Optionally change axis variables for similar graphs with other output parameters. |
| 9. | Repeat the process for similar graphs with other input parameters. |
For example, study the effects of height (zp) on performance.